Super-Resolution Microscopy via Optical Fluctuation Imaging
Published:
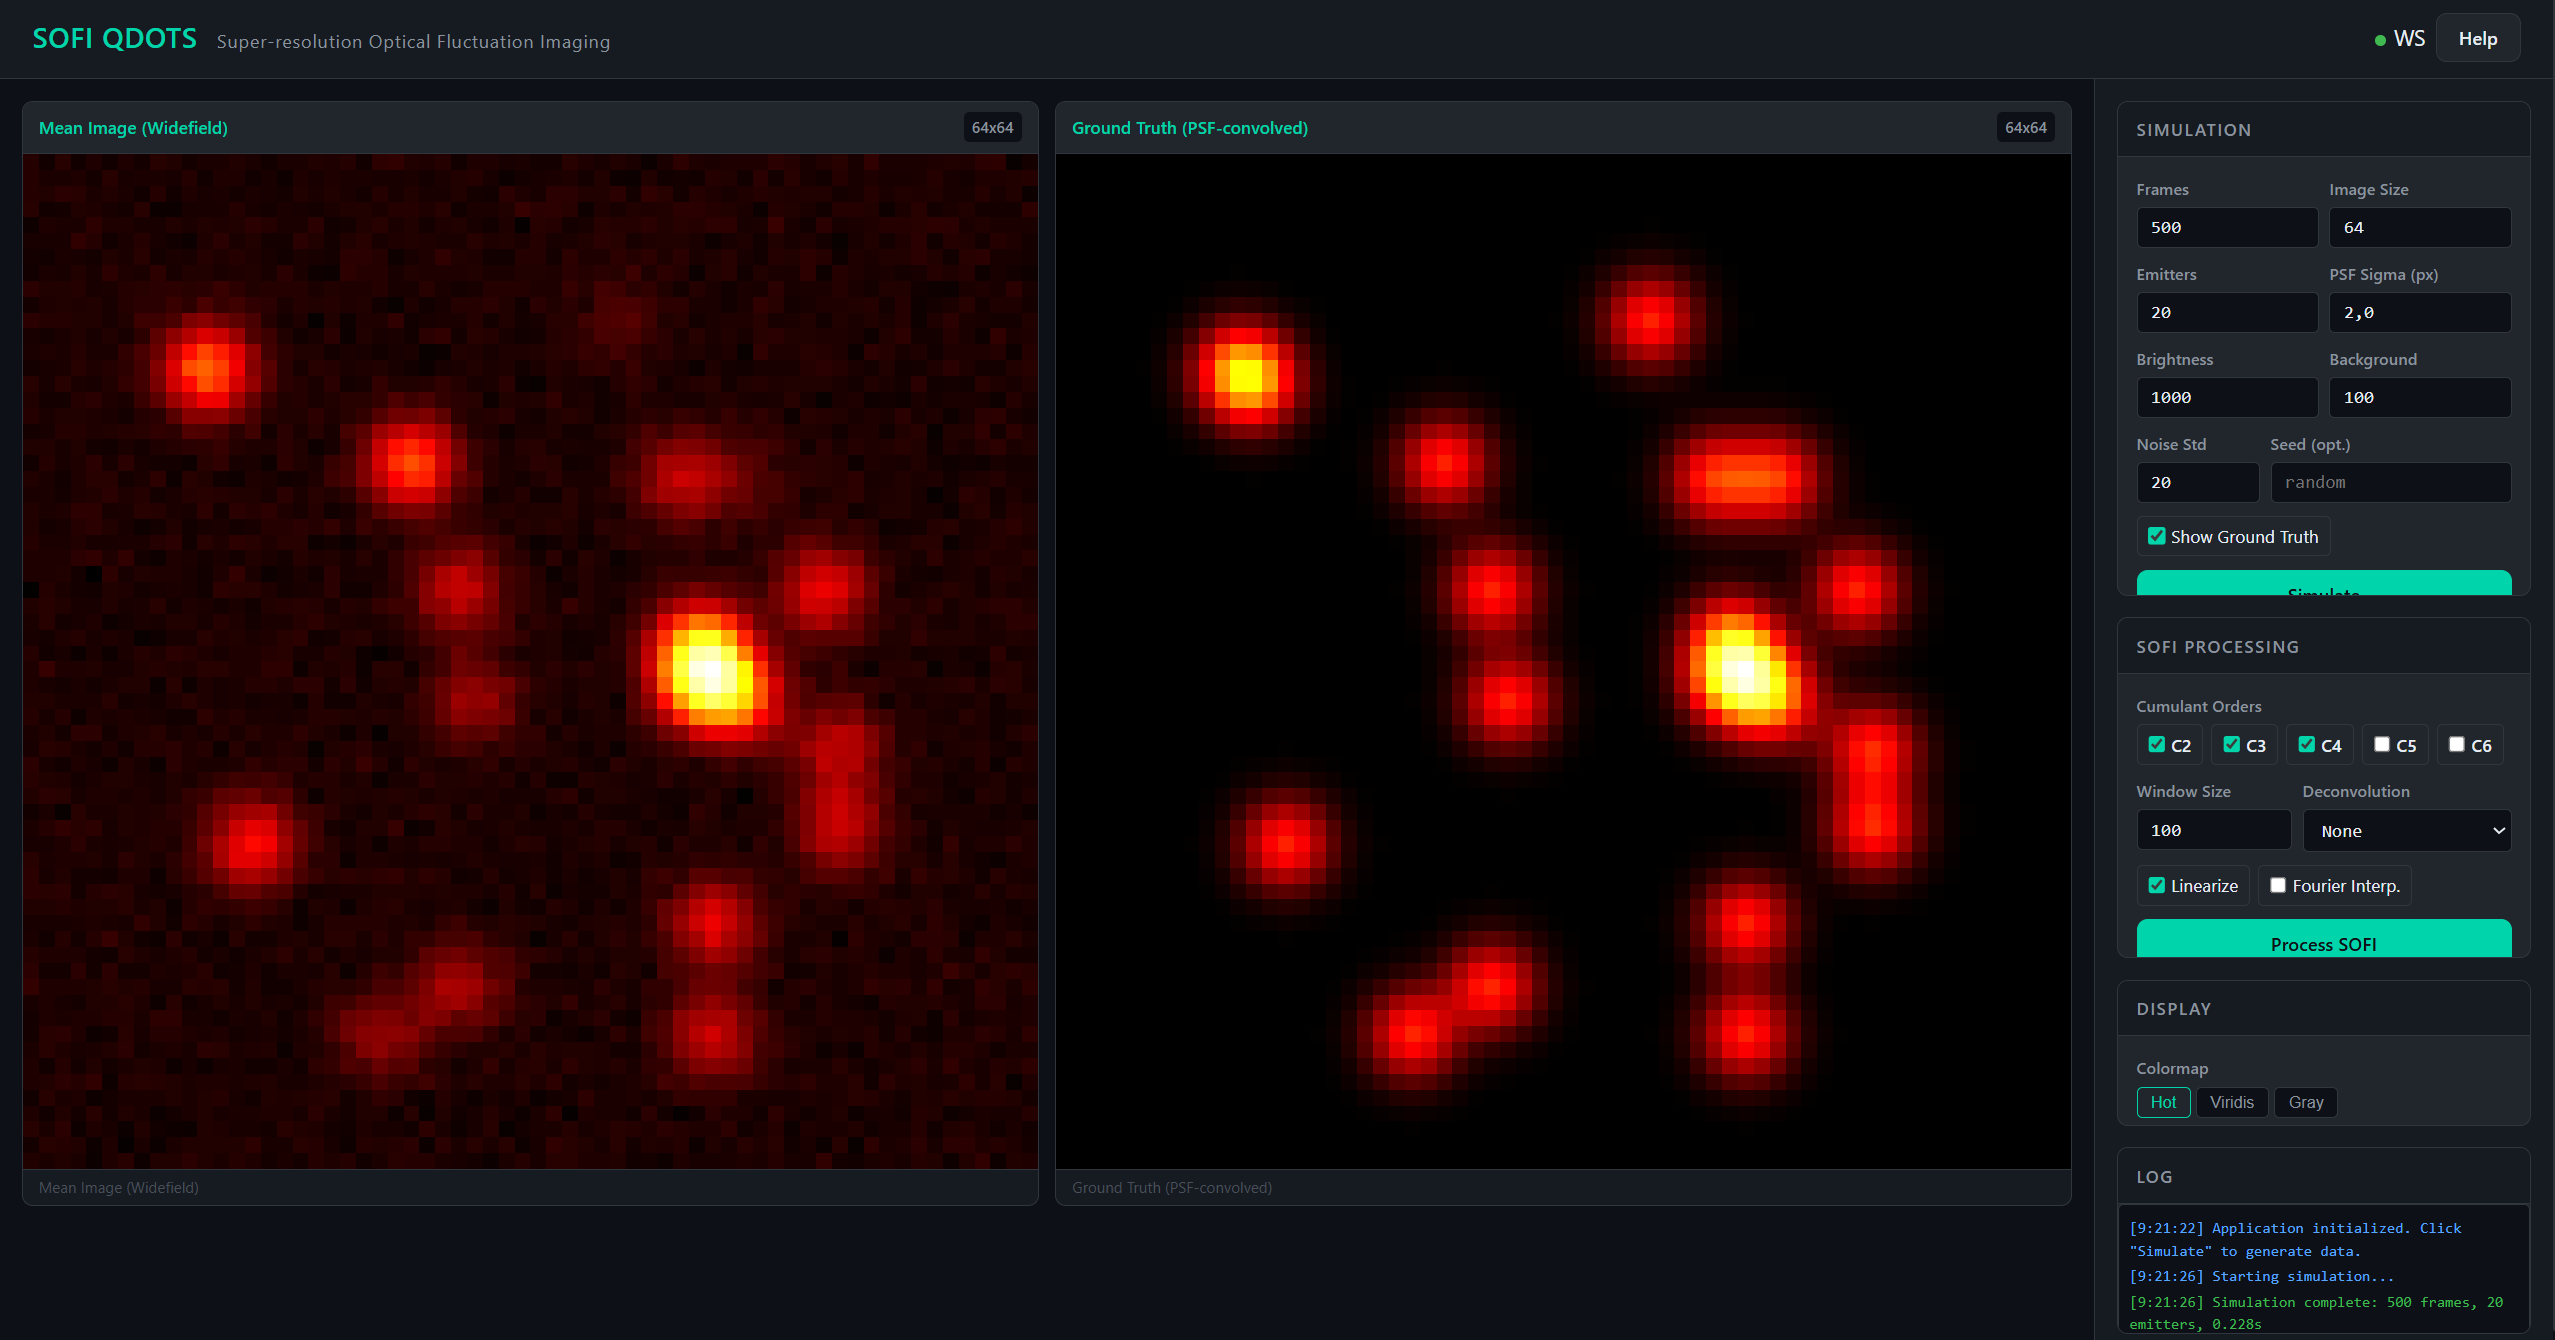
This project implements Super-resolution Optical Fluctuation Imaging (SOFI), a computational technique that extracts sub-diffraction spatial information from the temporal fluorescence fluctuations of independently blinking emitters — in this case, quantum dots. The fundamental insight behind SOFI is that the nth-order cumulant of intensity time traces narrows the effective point spread function (PSF) by a factor of sqrt(n), achieving spatial resolution beyond the classical diffraction limit without requiring the single-molecule sparsity that techniques like PALM or STORM demand.
Core algorithm
The fluorescence intensity at pixel position r and time t is modeled as F(r,t) = Sum_k eps_k * s_k(t) * U(r - r_k) + noise, where eps_k is the molecular brightness, s_k(t) is the stochastic on/off switching function, and U(r) is the microscope’s point spread function (PSF). The key mathematical insight is that the nth-order cumulant of this signal simplifies to C_n(r) = Sum_k eps_k^n * kappa_n[s_k] * U^n(r - r_k) – the PSF appears raised to the nth power, narrowing the effective PSF width by a factor of sqrt(n).
| The implementation computes cumulants from orders 2 through 6 using consecutive time lags to eliminate shot noise bias. For example, the 4th-order cumulant is: C_4 = <dF_0dF_1dF_2dF_3> - <dF_0dF_3><dF_1dF_2> - <dF_0dF_2><dF_1dF_3> - <dF_0dF_1><dF_2dF_3>. A synthetic quantum dot simulator generates realistic blinking statistics following power-law on/off time distributions P(t) ~ t^(-alpha) with alpha approximately 1.5, producing Levy-type statistics where the mean dwell time diverges. Fourier-domain zero-padding interpolation provides sub-pixel grid enhancement prior to cumulant computation, and two deconvolution strategies – Wiener filtering (F_hat(k) = H*(k)/( | H(k) | ^2 + 1/SNR) * G(k)) and Richardson-Lucy iterative maximum-likelihood deconvolution – further sharpen the reconstructed images. An nth-root linearization step corrects the eps^n brightness nonlinearity that would otherwise create extreme contrast ratios between emitters of different brightness. |
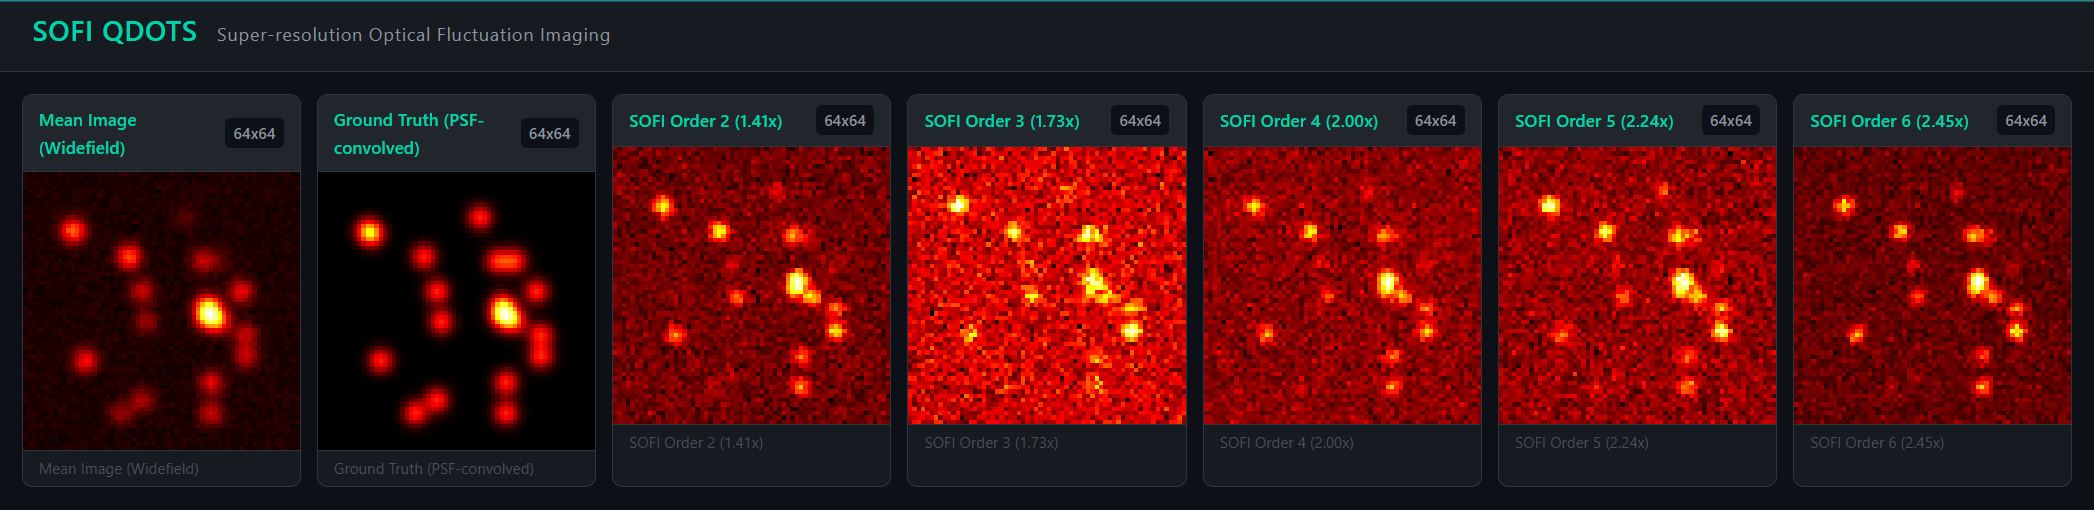
Resolution improvements scale with cumulant order: 2nd-order SOFI yields a 1.41x improvement (sqrt(2)), while 6th-order reaches 2.45x. In practice, this means resolving structural features separated by approximately 120 nm – well below the 232 nm diffraction limit (d_min = 0.61 * lambda / NA) for 532 nm excitation with a 1.4 NA objective.
Origin and modernization
This work originated during 2012-2014 at SCIAN-Lab, Universidad de Chile, in collaboration with the III Physics Institute at the University of Gottingen, Germany. It was the first successful SOFI implementation in Chile. The original codebase was written in MATLAB and remained in that form for years. The modern version is a Python/FastAPI web application with interactive visualization, preserving the full computational pipeline while making it accessible through a browser.

Related publication: SOFI of GABAB neurotransmitter receptors in hippocampal neurons (SPIE 2013)
Live application
▶ Live demo — sofi.fasl-work.com — SOFI super-resolution imaging from quantum dot fluctuations.