
Maqueta, Real Places Rebuilt in 3D from Fused Open Geodata
Published:
Public geodata about the same square kilometre is published by different institutions, in different formats, under different licences, and each describes one facet: what the land is covered with, how high the ground is, where the buildings and streets are, how many people live there, how tall the buildings probably are. Asking a question that crosses them needs the layers aligned on one geometry first, and needs the answer to say where each number came from. Maqueta is that base.
Fused, with provenance
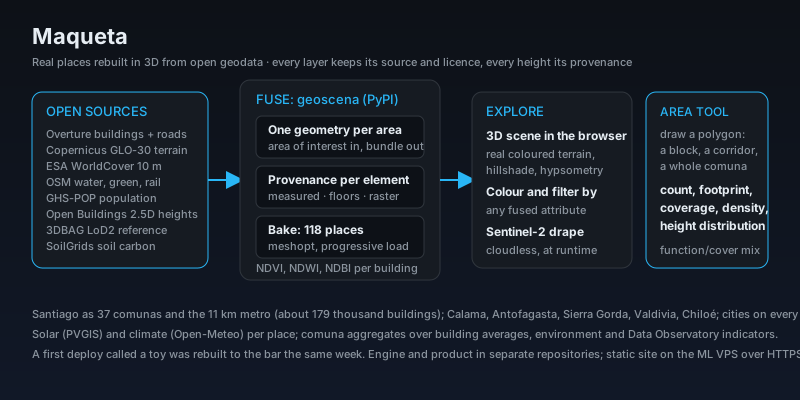
geoscena, a separately published package from its own repository, does the acquisition and fusion: given an area of interest it fetches every source family and fuses them into one scene bundle on a common geometry, with provenance on every element. Overture Maps buildings and roads (ODbL), Copernicus GLO-30 terrain, ESA WorldCover 10 m (CC-BY-4.0), OpenStreetMap water, green and rail (ODbL), GHS-POP population, Google Open Buildings 2.5D heights, 3DBAG LoD2 as an official reference layer and SoilGrids soil carbon. Every building height carries its provenance: measured, inferred from floor count, read from a height raster, or a default.
Explore, then ask
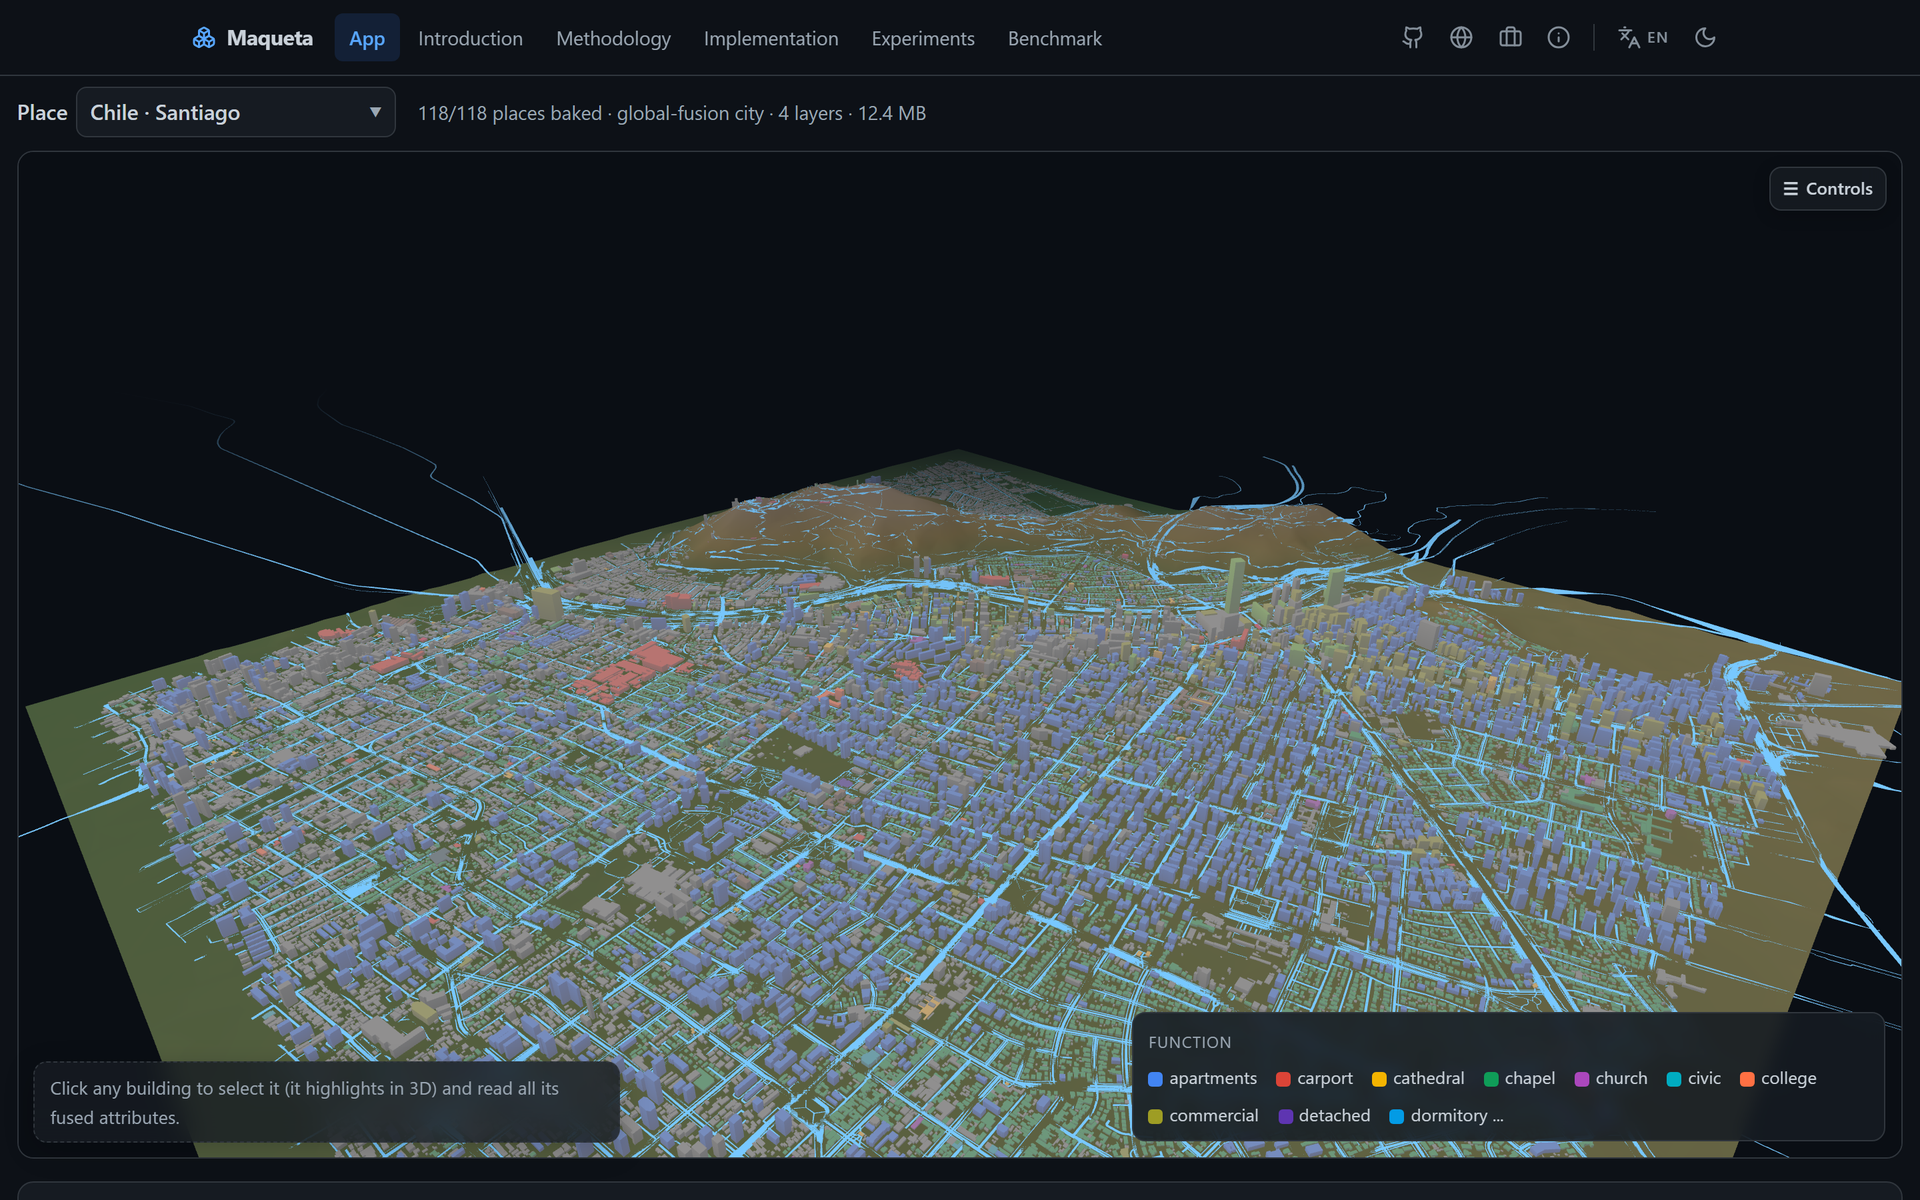
The Three.js workbench renders 118 baked places (the count the live site reports), from cities on every continent to Santiago split into its 37 comunas as separate cases and the 11 km metro as one case of about 179 thousand buildings, over real coloured terrain with hillshade and hypsometry, meshopt compression and progressive loading. Colour and filter buildings by any fused attribute, click one to read everything fused into it, drape a cloudless Sentinel-2 image fetched at runtime, and read the multispectral indices (NDVI, NDWI, NDBI) sampled per building in the bake, plus solar (PVGIS) and climate (Open-Meteo) per place. The area tool takes a polygon over any sub-area, a block, a corridor, a whole comuna, and summarises the buildings inside: count, footprint area, built coverage, density, height distribution, mean and median height, floors, and the mix of function, land cover and height provenance.
How it was built
It grew out of Atalaya, an explorer of the Chilean Data Observatory catalogue, from noticing that many separately published variables describe the same territory. The first deploy was called a toy, one city with flat colours, no streets and no interaction, and the product was rebuilt to the bar the same week; the analytical layer was planned, validated and then built rather than promised. Product and engine live in separate repositories; the site is static on the ML VPS over HTTPS.