
TailWatch: the classical velocity map beats the learned anomaly model
Published:
TailWatch: the classical velocity map beats the learned anomaly model
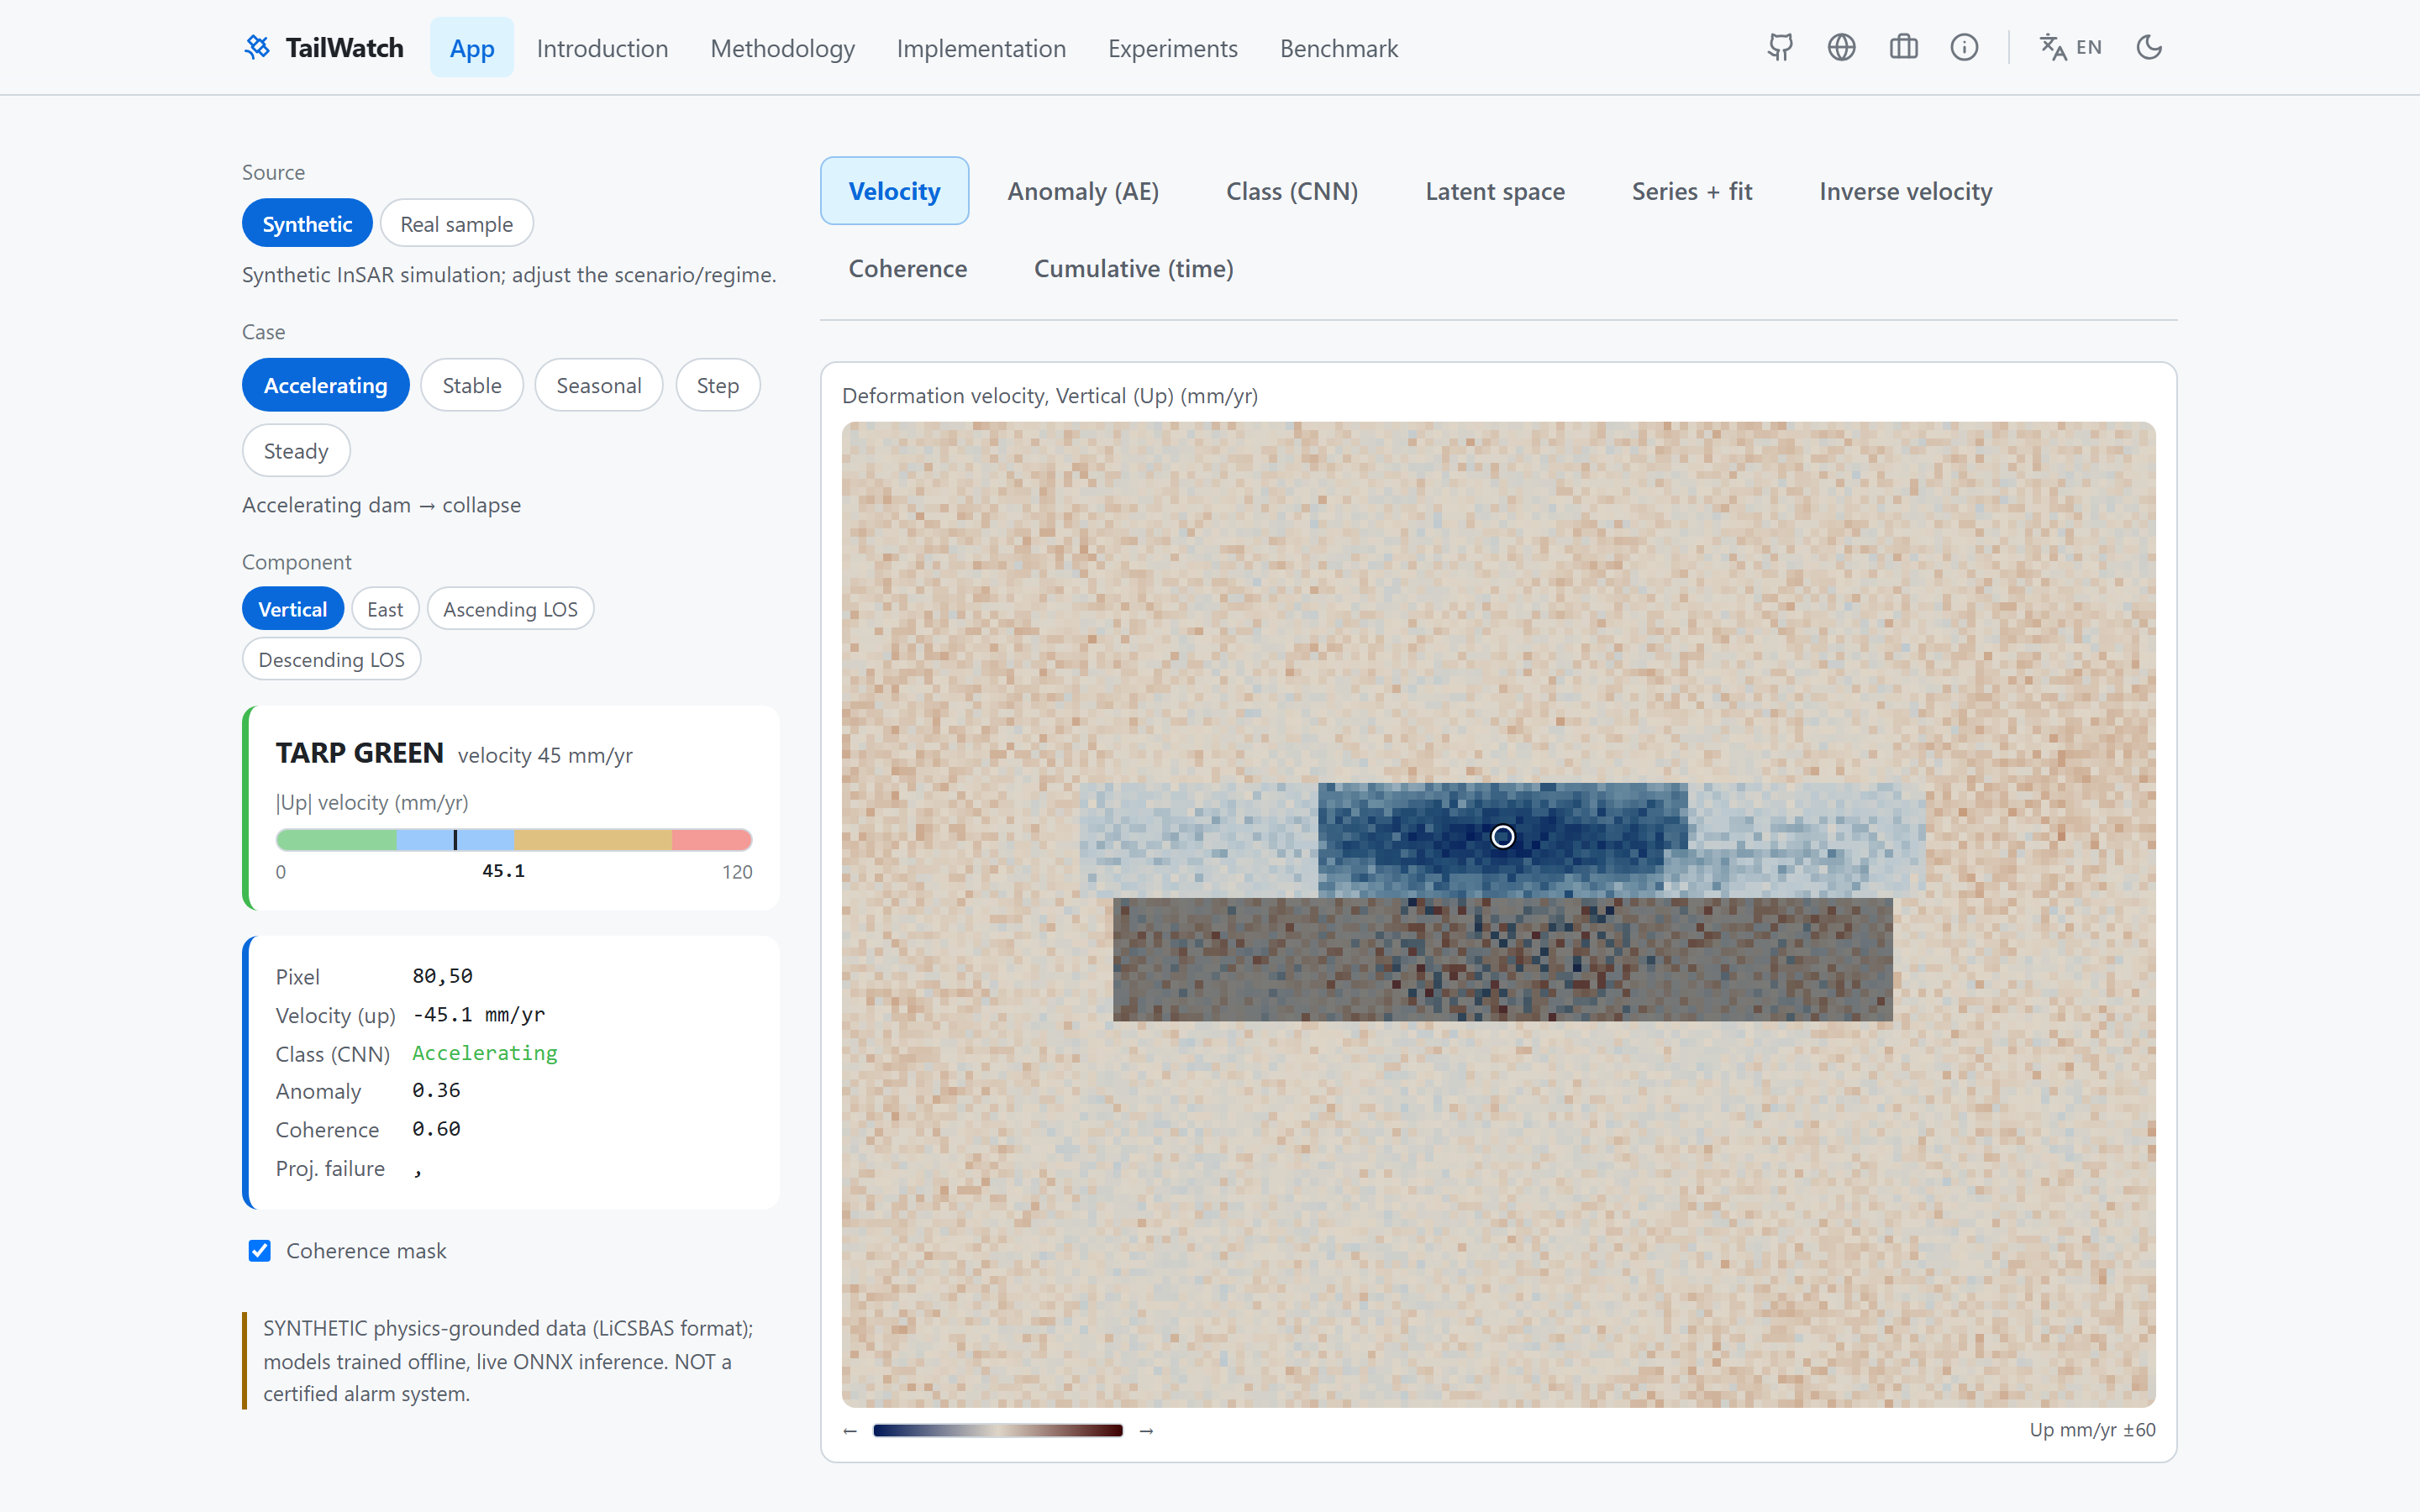
TailWatch is an InSAR ground-deformation studio: per-pixel ordinary-least-squares velocity with a slope t-test for significance, a two-geometry up-east decomposition, and a Fukuzono inverse-velocity time-of-failure forecast with split-conformal intervals. On top of that sit two learned models, a 1-D CNN classifier that runs live on whichever pixel you click and a denoising convolutional autoencoder anomaly map.
I built the learned anomaly detector expecting it to be the interesting part. The benchmark page says otherwise:
The plain method wins, and it is the number on the page. The CNN's held-out macro-F1 of 0.556 is reported too, rather than dropped for being unflattering.
The forecast is stated with the property that actually matters for a warning system, which is calibration rather than a point estimate: split-conformal coverage of 0.892 against a nominal 0.900 on a disjoint held-out set, a 5.7 percent median time-of-failure error, and zero false alarms across 60 control scenes of stable, linear and seasonal behaviour. A time-of-failure number with no band and no control scenes is not a warning, it is a guess with a date on it.
One scope note that belongs in the open: the single real Sentinel-1 sample is a COMET LiCSAR frame over the Campi Flegrei caldera, which is a volcano used as a domain-transfer probe, not a dam, and the app labels it that way instead of letting a real-data badge do work it has not earned. Live · source.