
Making Equations Visible
Published:
Making equations visible
Spent the day rethinking how technical content should look on my personal website. The rollings and blog posts had been mostly text, fine for casual notes, but the engineering work I’m doing deserves better visual representation.
The approach
Created a set of purpose-built SVG diagrams for each technical topic. Not generic illustrations, these are specific to the actual algorithms and parameters in the code.
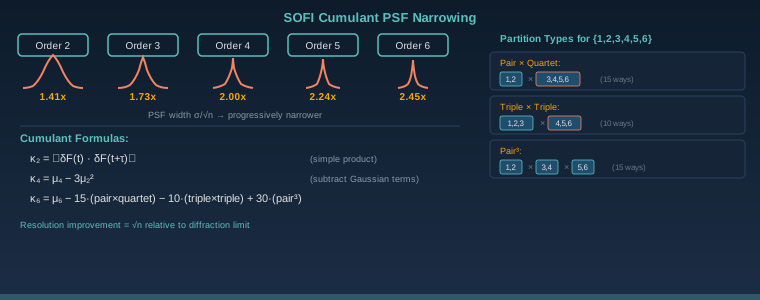
For equations, instead of plain unicode in paragraph text, I’m using styled HTML blocks that give them a visual identity:
s(t) = 6t⁵ - 15t⁴ + 10t³
Zero velocity AND acceleration at endpoints: s'(0)=s'(1)=s''(0)=s''(1)=0
The difference between a rolling that says “I implemented quintic smoothstep” and one that shows the polynomial, its derivatives, and a comparison graph against cubic is significant. The reader (future me, a colleague, or anyone exploring these projects) gets a much richer picture of what was actually built.
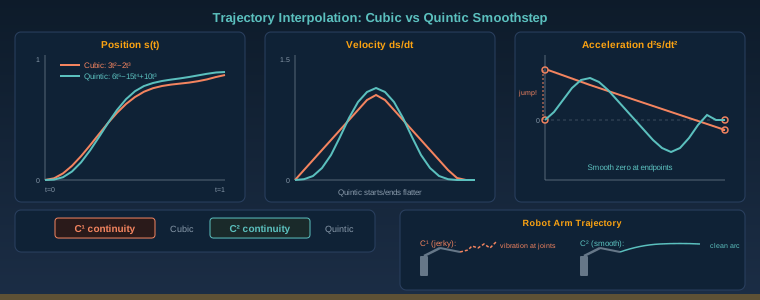
What worked well: the dark-background SVGs with blue/teal/orange accents match the equation cards, creating a consistent visual language across all technical content. What didn’t: getting SVG rendering right across browsers required strict XML validation, no HTML entities like —, only numeric references.
Each diagram is hand-crafted to match the actual code parameters. The spring constant in the haptic simulation SVG is k=0.2 because that’s what the code uses. The phase scale α≈π comes from real SLM parameters. Nothing is generic.