
Mine Pile Visualizer, Stockpile & Circuit Topology Explorer
Published:
A local-first visualization platform for exploring mining circuit topology, live material state, stockpile 3D structure, and historical profiler data. Built on Next.js 16 with React 19 and TypeScript, it consumes app-ready cached outputs from a mineral tracking simulation engine and presents them through four dedicated operator workspaces.
Business context
Mineral tracking systems generate vast amounts of operational data: belt block compositions, stockpile voxel states, quality distributions, temporal evolution. The raw data exists, but operators and process engineers need structured, route-specific views to answer operational questions: What is the current state of each stockpile? How has the feed quality evolved over the last shift? Where in the circuit are quality deviations occurring?
Key Performance Indicators, Process impact
| KPI | Baseline | With Mine Pile Visualizer | Impact |
|---|---|---|---|
| State visibility | Tabular reports, delayed | Interactive 2D/3D views, real-time cache | Spatial understanding of material state |
| Decision context | Fragmented data sources | Four dedicated workspaces, one per question | Focused operator workflows |
| Historical review | Manual data extraction | Profiler workspace with snapshot navigation | Shift-to-shift trend analysis |
| Circuit understanding | Static diagrams | Interactive topology with flow roles and anchors | Live operational context |
Four operator workspaces
Circuit
Structural reading of the modeled mining area. Interactive 2D/3D circuit topology diagram showing stages, nodes, edges, flow roles, and anchor inventory. Built with @xyflow/react and dagre for automatic graph layout.
Live
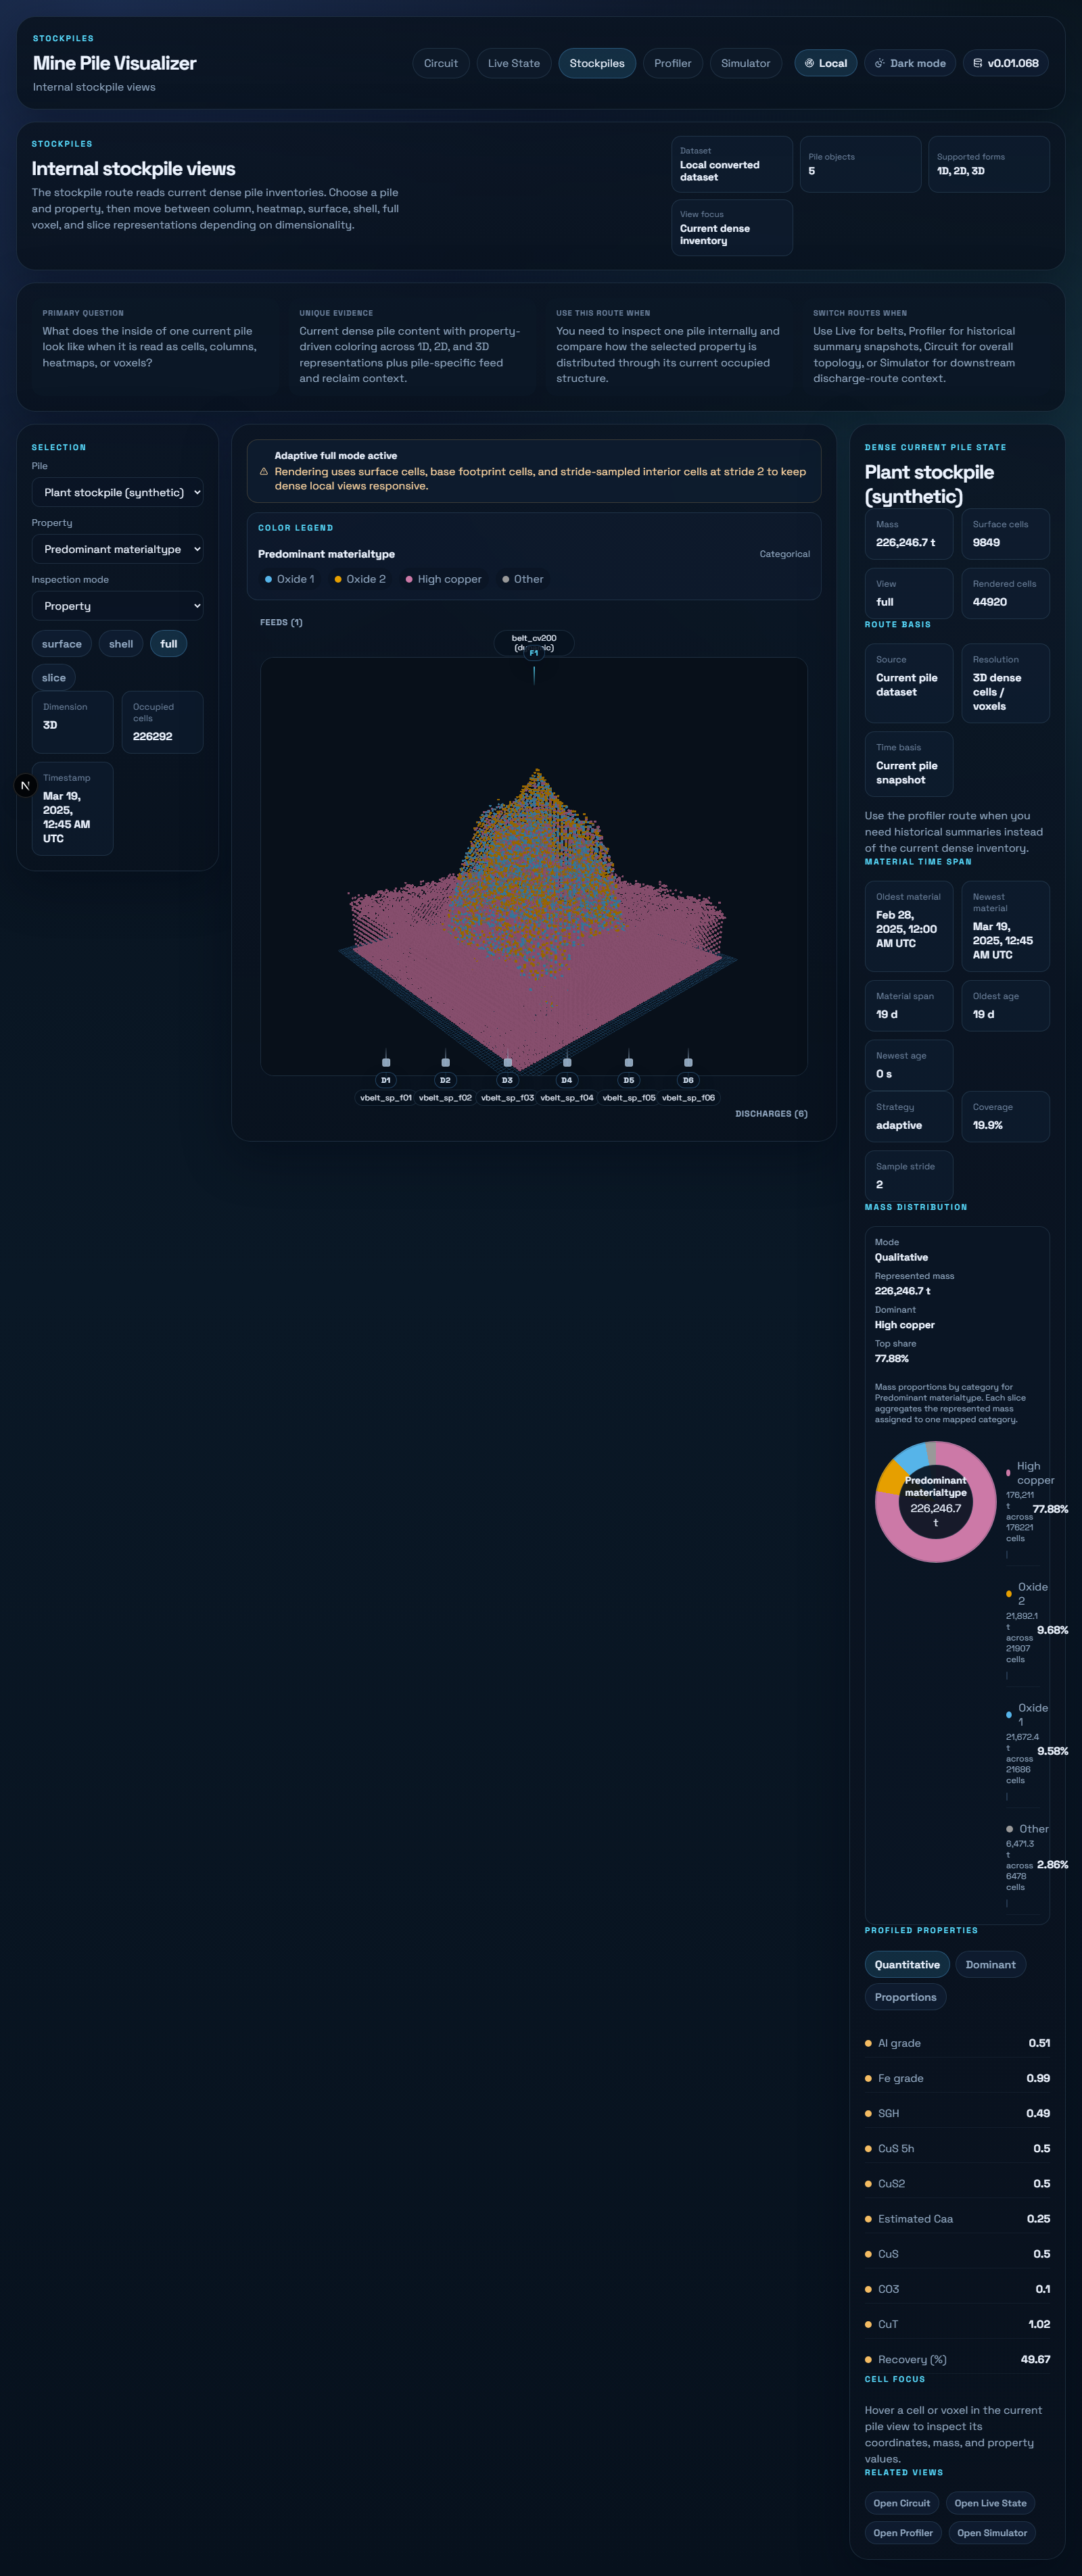
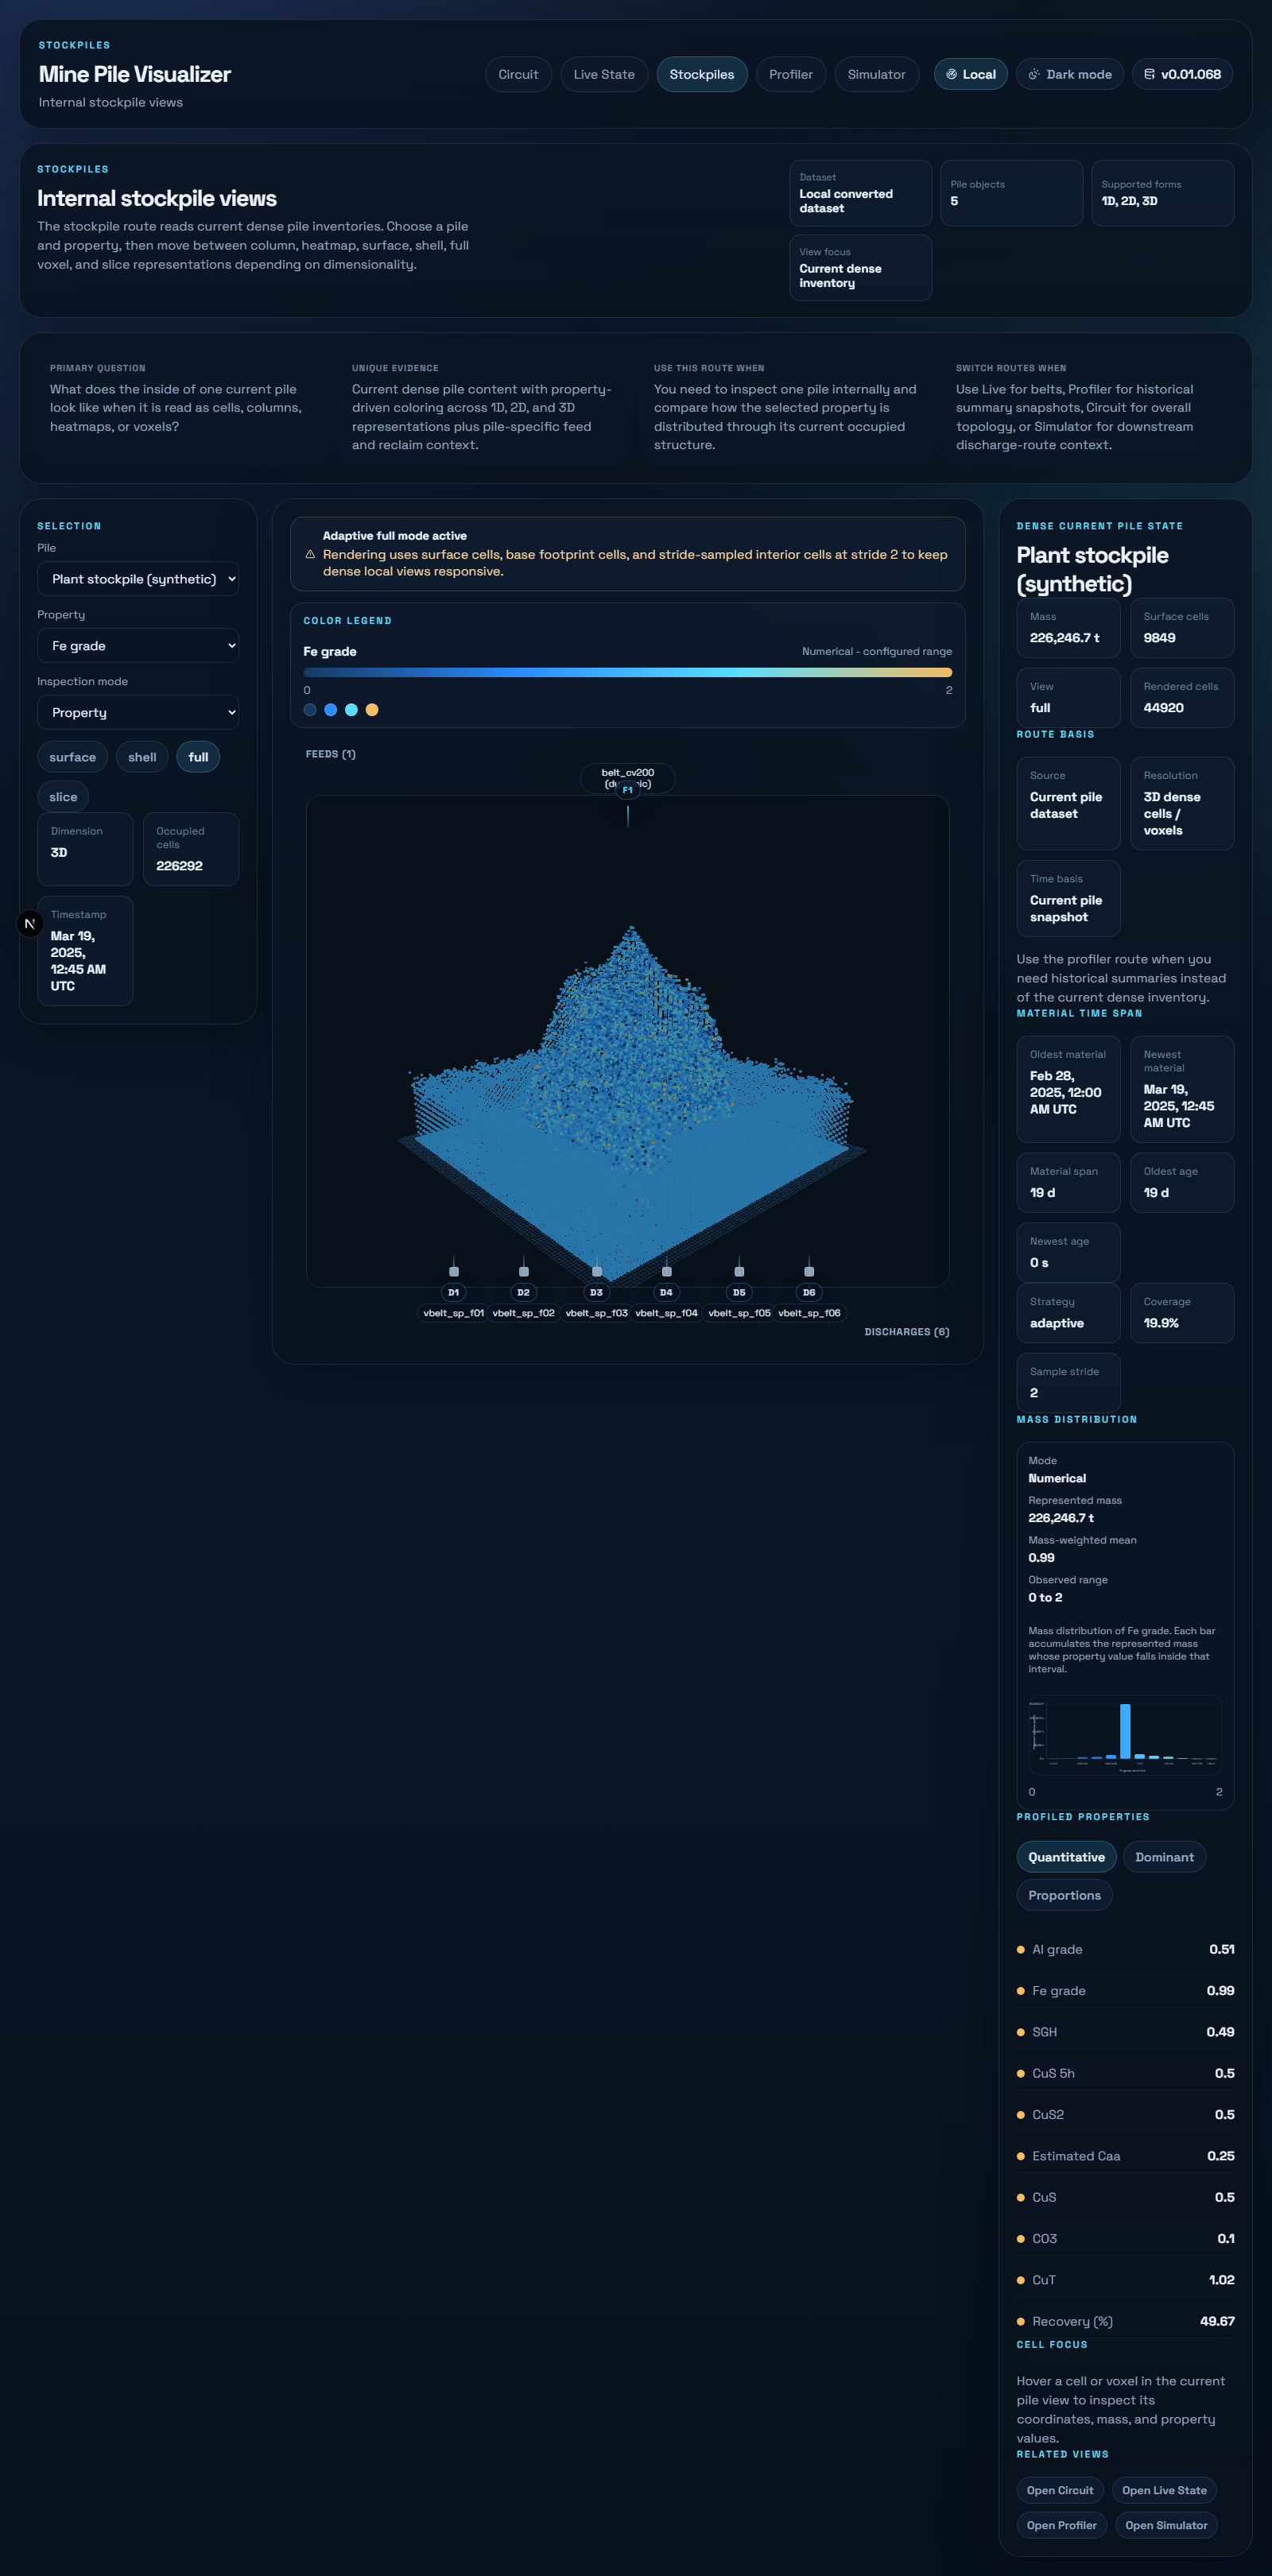
Dense current-state inspection. Belt block compositions, stockpile voxel rendering (3D with @react-three/fiber + instancedMesh), mass histograms, quality distributions. Answers: What is happening right now?
Profiler
Historical summarized reading. Snapshot navigation through time, quality time-series, delta comparisons between snapshots. Answers: How has this evolved over the shift/day/week?
Simulator
Pile-centered discharge reading. Central pile structure, discharge routes, grouped reclaim sequences. Answers: Where does the material go when we extract?
Pile cells: (ix, iy, iz, massTon, timestamps, quality columns)
Belt blocks: (position, massTon, timestampOldest/Newest, qualities)
Dense binary format for sub-second loading of voxel datasets with thousands of cells
Technical stack
- Framework: Next.js 16 (App Router) + React 19 + TypeScript 5
- 2D Diagrams:
@xyflow/react+dagrefor circuit topology - 3D Rendering:
@react-three/fiber+ Three.js +dreifor stockpile voxels - Data Format: Apache Arrow IPC for dense block/cell datasets
- Validation: Zod 4 for runtime contract enforcement
- Testing: Vitest (unit/component) + Playwright (E2E)
- Local-first: No external services, reads app-ready cache from local filesystem
Live application
▶ Live demo, minepile.fasl-work.com, local-first 3D mining stockpile and circuit explorer.
Recent updates
v1.00.001 (April 2026): Folded the Stockpiles workspace into Live (Piles/VPiles). Resolved 3D voxel rendering issue, moved from fragile instance-color to explicit merged visible-geometry approach.